How to Improve your Models Effectively - Beyond mAP as a Metric
August 29,2023
By the end of this blog post, you should be able to:
- Understand the best practices behind iterative model improvement and why mAP plays one part of an overall model improvement strategy
- Identify the phases of model improvement and when to use the ideal strategy
- Project model improvement lifecycles to customers and stakeholders so they can know when to expect results
Connecting model performance to ROI (Return on Investment)
Numbers in a vacuum mean nothing. A model with perfect metrics provides $0 if it doesn’t meet business needs.
Before looking at the metrics of a model—one should always understand how the implementation and performance of a machine learning (ML) model impacts the bottom line!
Let’s consider some examples:
- Missing a detection costs more - every time a faulty part gets shipped to customers, the company loses $X in returns and the immeasurable loss of customer trust, or a enemy tank was not picked up on the satellite video feed and tactical superiority turns over to them - costing the battle and loss in resources
- A wrong detection costs more - A nuclear power plant monitors for visual signs of damage and shuts down the facility if a detection occurs, or an autonomous vehicle mistakes a stop sign for a yield sign and causes a large accident
In each of these scenarios, some metrics will be more important than the others
Evaluating a model
A quick summary of the metrics tied to a model’s train results:
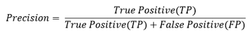
1) Precision: Given a detection, how likely will that detection be a correct true positive result or a false positive misfire. For eg. A dataset has one instance of an apple present and a model detects two apples - it would have a precision rate of 50%. Formula for precision:
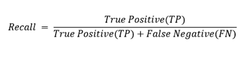
2) Recall: how likely will a model fail to detect the object when present (aka rate of false negatives). For e.g. A dataset has two instances of oranges present and a model detects one orange while failing to detect the other—it would have a recall rate of 50%. Formula for recall:
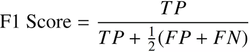
3) F1 score: a combination of precision and recall (using harmonic mean), representing the overall accuracy of a model, and a maximal F1 score represents an optimally tuned model. Formula for F1:
4) Mean Average Precision (mAP): the average precision per class of a model calculated over recall values from 0 to 1, providing a performance curve to understand how models perform in ranges. Formula for mAP:
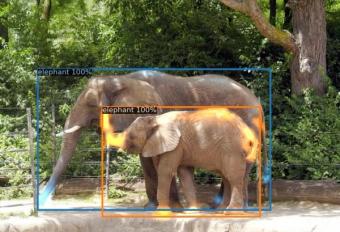
👨🏫 A model’s evaluation metrics represent how many true positives, false positives, and false negatives were determined during training
Numbers & formulas only tell a part of the story
Given two models trained on the same architecture, training data, and hyper parameters A and B; let’s assume that model A has better metrics across all standard evaluation metrics by a factor of two. Model A on paper appears considerably better!
❓ Would it be safe to assume that model A should be the best solution for deployment? Under what conditions would it be possible that model B outperforms model A?
It comes down to how much the validation data matches the deployment conditions and where the cost of success/failure stems from!
All things the same between model A and B's training processes, the only thing that could cause such a large difference would be the validation data the model used to produce the results!
Let’s assume that the engineering team deploys both models to the field and they determine that model B performs significantly better (a common occurrence in the real world).
Model A most likely had data that was too easy to work with or did not not accurately represent the harsh working conditions the model would be deployed to. Although model B looks worse on paper—it ultimately performed better in the company’s business case!
A real world example:
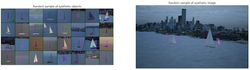
The following model was trained using entirely synthetic data. The ROI on a sailboat detection model could take the following forms:
- Value comes from positive detections to determine amount of ships going to-and-from harbor
- Value comes from detecting enemy sailboats in a protected region
- Value comes from determining if a vessel in the water way meets the “commercial vessels only” regulation
The deployment conditions determine the validation set
This model’s validation set consists mainly of coastal backgrounds in low-to-medium lighting conditions and accurately represents the real world deployment conditions for the customer.

The training data should effectively reflect the validation data.
Phases of model development
Phase 1 - Initial model configuration
Evaluation metrics play an important role in the initial model, as they provide a sense of progress against the same validation set.
🚨 The validation set must remain the same between train jobs for the numbers to be relative and relevant. Change the validation set and the numbers can’t be compared effectively!
The initial model training process typically focuses on identifying the ideal set of hyper parameters, data preprocessing/augmentation selections, and architecture adjustments.
Phase 2 - Adjusting the training data
Once configuration has been settled on, identifying where the model fails when training against the validation data plays a critical role.
After the initial model has been trained the results should be rendered to understand what went right and wrong.
Consider this example from another model trained on synthetic data in false positives were present:

By reviewing the data, it appears that boats far off in the horizon get mistaken as sail boat. Improving this model would then be a matter of finding additional instances of sail boats and vessels far off in the horizon for the model to train on.
Phase 3 - Deployment and data collection
Now the model will be tested in the real world.
When done correctly, phase three should be thought of as “phase two with extra steps”, as the process of visualizing the models performance on challenging real world test data will reveal the model’s failure.
The main differentiator here will be the collection of new data and introduction to new edge cases not originally captured in phase two. Realistically, new use cases and environment conditions will spring up that were not originally anticipated!
Conclusion
Model metrics provide relative information that should be used to compare the results of iterative training jobs.
The ultimate north star should always be how well the model performs on the validation data and how the model will be generating business value.
A model with high precision but low recall may provide large amounts of value if trained on the right data and deployed in the matching conditions!
Ready to generate data? Create a Bifrost.ai account and start generating synthetic data today! Contact us at sales@bifrost.ai to enable access to the generative channels you need.